Maintenance Planning with Early Failures
This Reliability Que will discuss an example of how Weibull analysis qualitative results showing early failures (Infant Mortality) can be utilized to quantitatively drive the decision making process in Reliability Centered Maintenance (RCM) programs.
RCM Basics
As defined in NAVAIR 00-25-403, “Guidelines for the Naval Aviation Reliability-Centered Maintenance Process”, RCM is “an analytical process to determine appropriate failure management strategies, including Preventive Maintenance and other actions that are warranted to ensure safe operation and cost-wise readiness”. Similarly, NASA defines the purpose of RCM as “a process that is used to determine the most effective approach to maintenance. It involves identifying actions that, when taken, will reduce the probability of failure and which are the most cost-effective.” A formal RCM process identifies the following seven steps, in sequence:
- Define System Functions – the desired capability of the system, how well it is to perform, and under what circumstances
- Analyze the Potential Functional Failures – the failed state of the system (when the system falls outside the desired performance parameters)
- Determine Failure Modes – the specific condition causing a functional failure
- Describe Failure Effects – the description of what happens when each failure mode occurs
- Determine Failure Consequences – the description of why the loss of function matters
- Develop Maintenance Tasks and Intervals – the description of the applicable and effective tasks, if any, performed to predict, prevent, or find failures
- Consider Other Logical Actions – including, but not limited to, run-to-failure, engineering redesigns, and changes/additions to operating procedures or technical manuals
Why RCM?
Over the years, RCM has been used to achieve significant cost savings in a variety of industries, as well as U.S. Department of Defense programs. For example, RCM performed on the F-15 Environmental Control, Fuel, Landing Gear, Flight Control, and Oxygen and Canopy systems resulted in 538 recommended changes to maintenance procedures, with an expected savings of $21M/year (~450K manhours).
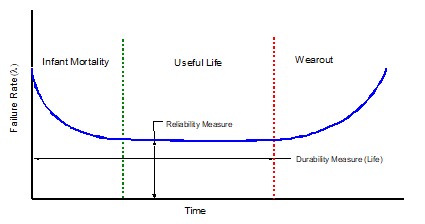
The objective of an effective RCM program is not to eliminate failures (that’s the job of Design for Reliability (DFR) and Design for Maintainability (DFM) processes), but to reduce or mitigate the consequences of a failure when one occurs. The consequences of failure are usually assessed by their impact in the following areas (and are considered critical elements in a comprehensive Asset Management strategy):
- Personnel and Equipment Safety
- Environmental Health/Compliance
- Operations (Availability)
- Economics
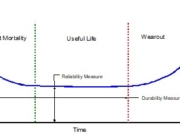
By utilizing a Weibull distribution, an analyst can determine the reliability of a system for a given period of time and also have insight into additional failure characteristics (e.g. early failures, constant failure rate, wearout condition). The following example discusses a Weibull analysis showing an infant mortality failure characteristic which was performed on a system as part of an RCM process and how the results led to a very unique maintenance management decision.
Early Failures
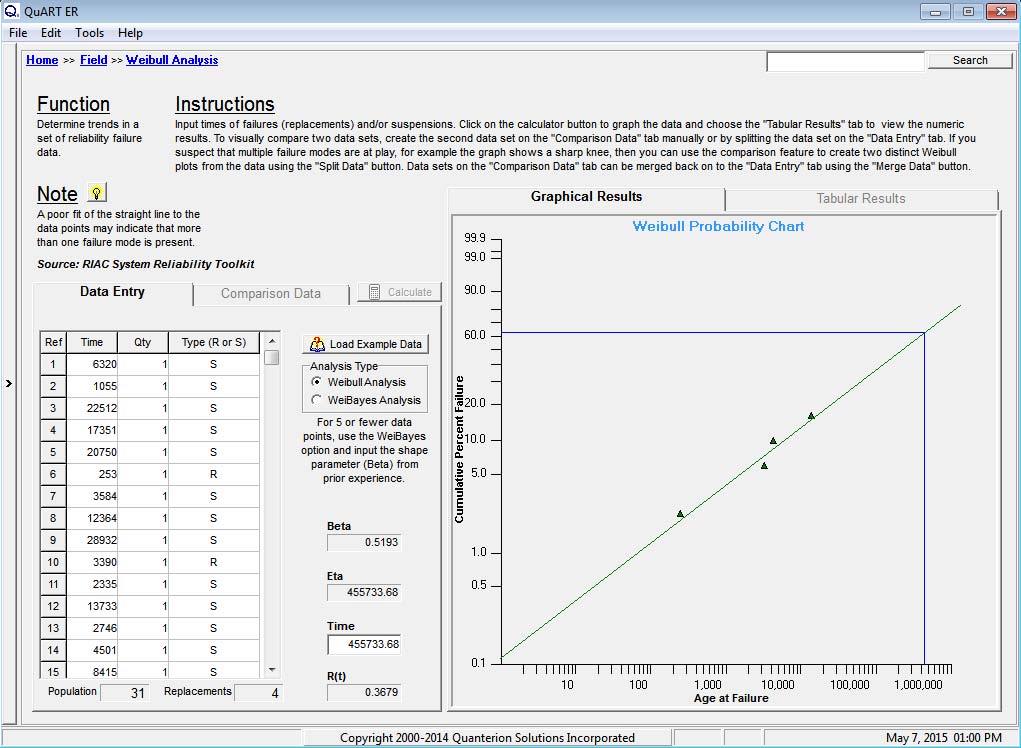
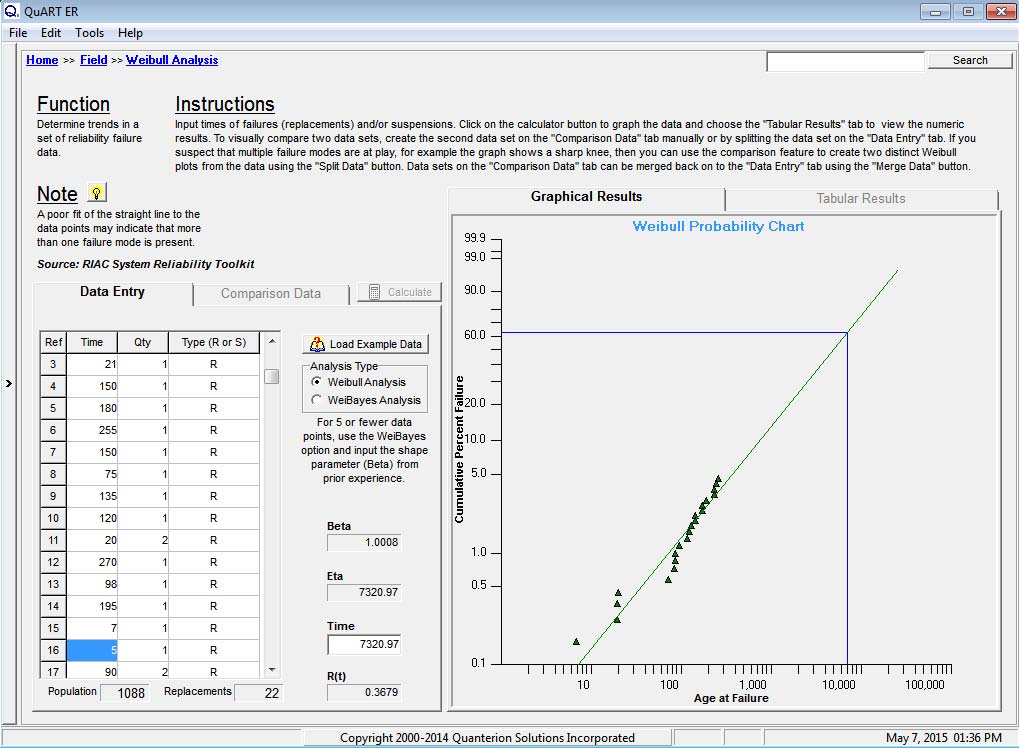
In this example, a bus company began having failures in their fuel system and requested an analysis of its very limited dataset. There were a total of 31 buses in the fleet, but 4 recent failures were of great concern, as they resulted in emergency repairs. The buses were not new, but the failure mode was and, as such, some thought was required when developing the dataset for analysis. After discussions with maintenance personnel, a dataset was developed based on the last time of replacement for the component of interest. This data was analyzed, with the results shown in Figure 1.
 Figure 1: Early Failures
A closer inspection of the results in Figure 1 indicates that the dataset can be represented by a 2-parameter Weibull distribution. The failure data points are well in line with the predicted result. Note that only failure data is plotted when using the Weibull analysis Rank Regression technique. This is not to say that suspension data is not important to the analysis, as it is a critical component to the reliability prediction result. Although not plotted, the suspension data does influence the appropriate plot positions of the failure data. For more information on the Weibull Analysis process click here.
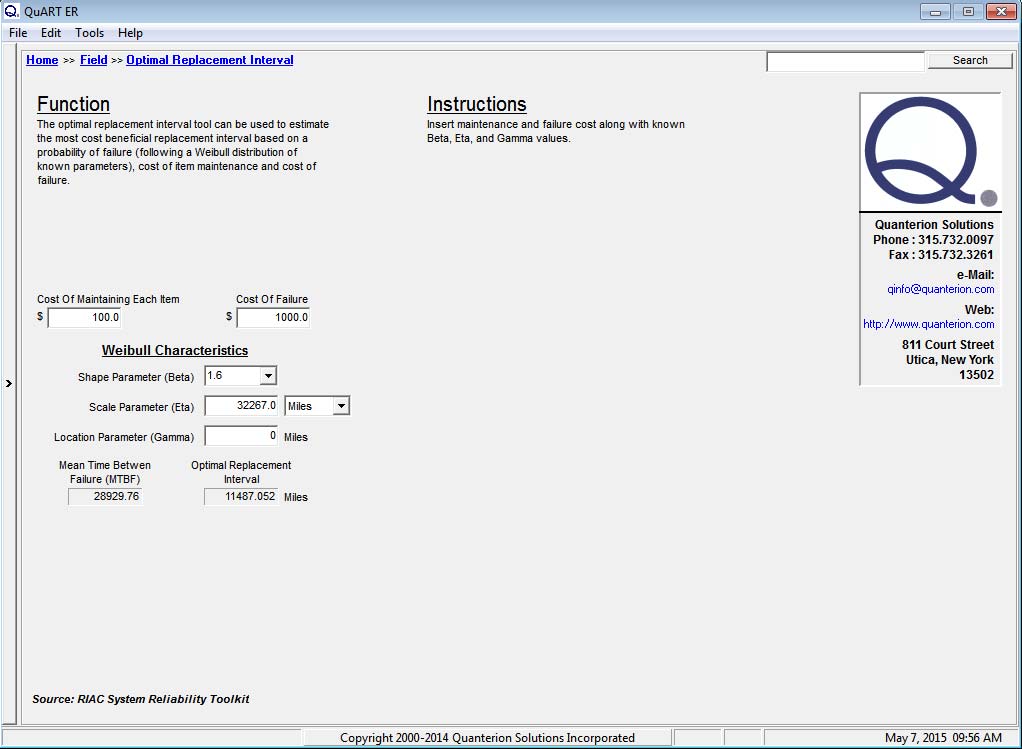
In this example, the Weibull Analysis tool in QuART-ER was utilized to perform the analysis. As can be seen from the figure, the few failures that did occur seem to align fairly well with the predicted Weibull analysis plot, leading to the conclusion that the dataset is conforming to a 2-parameter Weibull distribution. With the Weibull distribution, Eta is utilized to calculate the Mean Time To Failure (MTTF) for the system while Beta describes the failure characteristics (e.g. Beta < 1 = early failures, Beta = 1 = constant failure rate, Beta > 1 = wearout condition). Of particular importance in the RCM decision-making process is the value of Beta. In this case, Beta is much less than 1 indication Infant Mortality in the system.
The characteristic life, Eta=455,734 miles, is also quite large and would imply that the component under analysis is robust and should not be experiencing a large number of failures. This can be put into perspective by calculating the Mean Miles Between Failure (MMBF) using the following equation:
This result predicts that the average component should not fail during the lifetime of the bus. As mentioned previously, the value of Beta is critical to the RCM decision-making process. In the current example, the value of Beta = 0.5193 is much less than 1.0, indicating that the failures are an extreme case of infant mortality. Although infant mortality is a common failure characteristic in electronic equipment, it is far less common in mechanical components and mitigating the problem would require more information.
Armed with this new information, the maintenance person who had requested the analysis and supplied the dataset was contacted. More information was needed about the failure mode itself. The individual with the data did not have this information, so he contacted the shop floor manager. The shop floor manager indicated that the time-to-replacement data being utilized was correct, as the component (a brass elbow in the system) was replaced when another component in the system was serviced because it was convenient to do so at that time. He also indicated that the elbow was failing due to clogging, which should not happen because there was a pre-filter in the system, just before the elbow, to prevent that from occurring.
After much discussion, the decision was made to replace the pre-filter in addition to the elbow when maintenance was performed on the system. To date, no further failures have been reported. This was a case when unusual data led to the usual questions addressed to the right people and a solution was found.
This example highlights several aspects of an effective RCM analysis:
- Throwing more maintenance at a problem is not necessarily a solution
- Everyone’s input is important in identifying the problem and the potential solution(s)
- Actions should be taken based on what the data is telling you, especially the Weibull analysis value of Beta
Conclusion
This discussion was meant to illustrate how Weibull analysis can be used to guide a RCM strategy. Understanding the underlying failure distribution of an item is critical in order to determine whether or not preventive maintenance is appropriate and cost-effective and, if so, at what interval. Equally important is the understanding of preventive and corrective maintenance times, preventive and corrective replacement costs and equipment design life. Finally, a clear understanding of safety and mission reliability requirements is critical for optimizing an RCM-based preventive maintenance program.
