Maintenance Planning with a Constant Failure Rate
This Reliability Que will discuss an example of how Weibull analysis qualitative results showing a constant failure rate affect the maintenance planning process. The qualitative results can be utilized to quantitatively drive the decision-making process in Reliability Centered Maintenance (RCM) programs.
RCM Basics
As defined in NAVAIR 00-25-403, “Guidelines for the Naval Aviation Reliability-Centered Maintenance Process”, RCM is “an analytical process to determine appropriate failure management strategies, including Preventive Maintenance and other actions that are warranted to ensure safe operation and cost-wise readiness”. Similarly, NASA defines the purpose of RCM as “a process that is used to determine the most effective approach to maintenance. It involves identifying actions that, when taken, will reduce the probability of failure and which are the most cost-effective.” A formal RCM process identifies the following seven steps, in sequence:
- Define System Functions – the desired capability of the system, how well it is to perform, and under what circumstances
- Analyze the Potential Functional Failures – the failed state of the system (when the system falls outside the desired performance parameters)
- Determine Failure Modes – the specific condition causing a functional failure
- Describe Failure Effects – the description of what happens when each failure mode occurs
- Determine Failure Consequences – the description of why the loss of function matters
- Develop Maintenance Tasks and Intervals – the description of the applicable and effective tasks, if any, performed to predict, prevent, or find failures
- Consider Other Logical Actions – including, but not limited to, run-to-failure, engineering redesigns, and changes/additions to operating procedures or technical manuals
Why RCM?
Over the years, RCM has been used to achieve significant cost savings in a variety of industries, as well as U.S. Department of Defense programs. For example, RCM performed on the F-15 Environmental Control, Fuel, Landing Gear, Flight Control, and Oxygen and Canopy systems resulted in 538 recommended changes to maintenance procedures, with an expected savings of $21M/year (~450K manhours).
The objective of an effective RCM program is not to eliminate failures (that’s the job of Design for Reliability (DFR) and Design for Maintainability (DFM) processes), but to reduce or mitigate the consequences of a failure when one occurs. The consequences of failure are usually assessed by their impact in the following areas (and are considered critical elements in a comprehensive Asset Management strategy):
- Personnel and Equipment Safety
- Environmental Health/Compliance
- Operations (Availability)
- Economics
By utilizing a Weibull distribution, an analyst can determine the reliability of a system for a given period of time and also have insight into additional failure characteristics (e.g. early failures, constant failure rate, wearout condition). The following example discusses a Weibull analysis showing a constant failure rate characteristic. The analysis was performed on a system as part of an RCM process and the results led to several potential maintenance management decisions.
The Constant Failure Rate
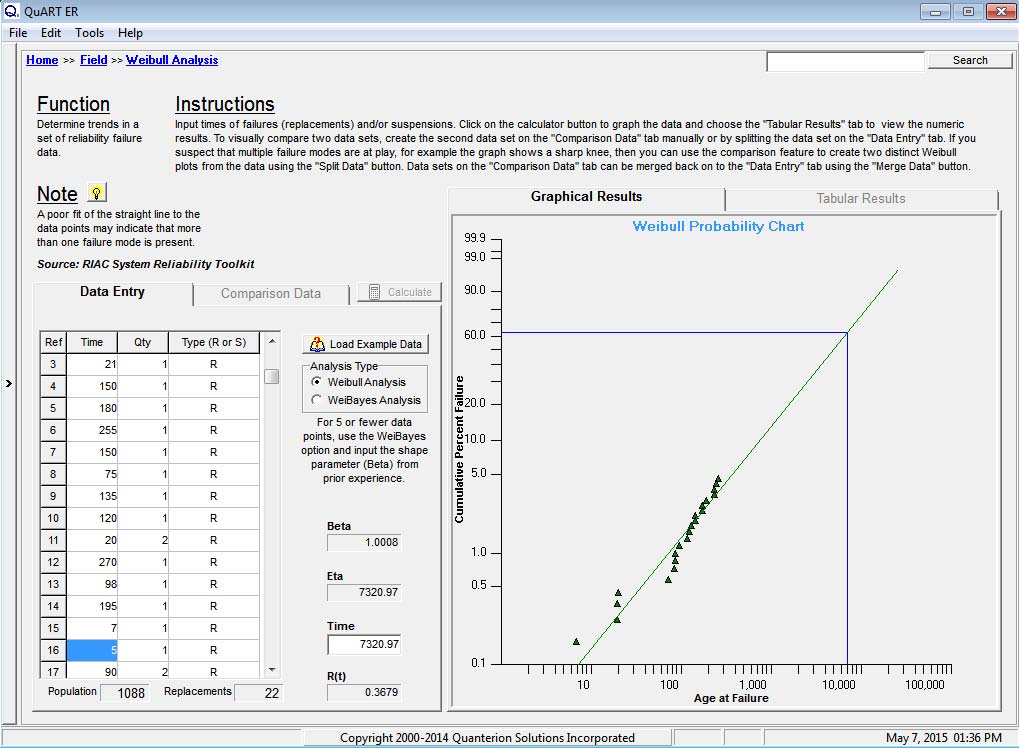
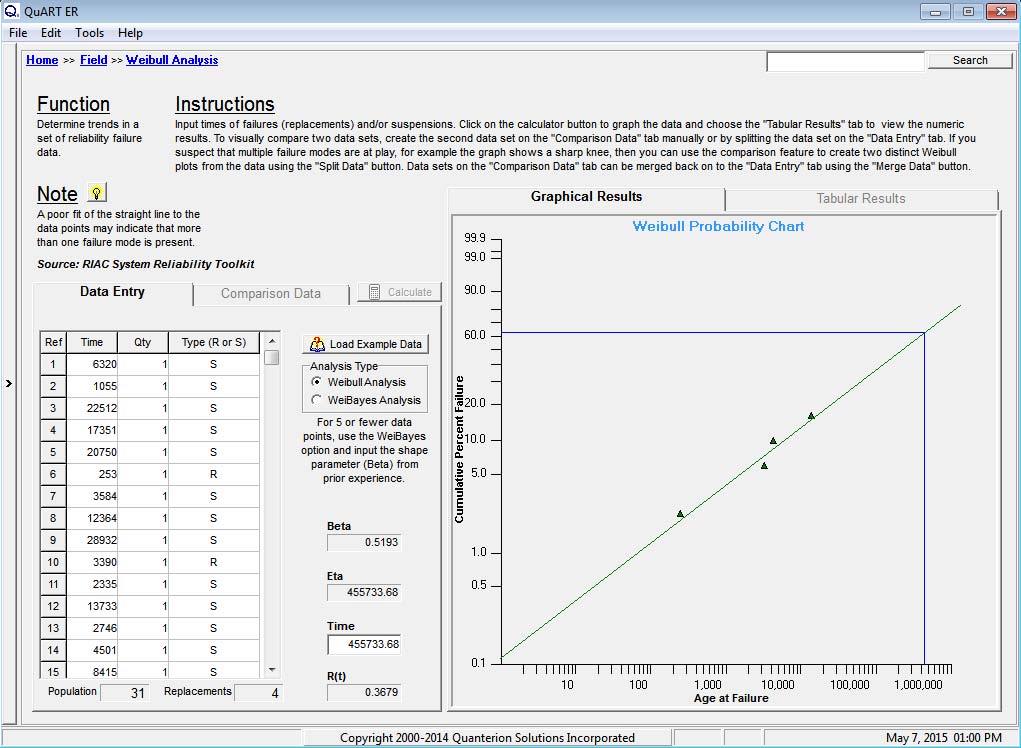
This example discusses the results of a 2-parameter Weibull analysis of a Line Replicable Unit (LRU) installed on a rotary wing aircraft. As the LRU was not a flight critical component, the goal of the analysis was to see if there was an optimal replacement interval for the LRU. The results of the analysis are shown in Figure 1. By definition, an LRU is not repairable at the time of replacement and they are often susceptible to multiple failure modes. As a result, competing failure modes may be evident in a Weibull plot. The other possibility is that there are a large number of competing failure modes that blend together in an analysis, making the task of properly separating failure modes impossible without a great deal of additional effort and information.
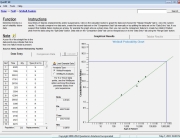
 Figure 1: Constant Failure Rate Data
A closer inspection of the results in Figure 1 indicates that the dataset can be represented by a 2-parameter Weibull distribution. The failure data points are well in line with the predicted result. Note that only failure data is plotted when using the Weibull analysis Rank Regression technique. This is not to say that suspension data is not important to the analysis, as it is a critical component to the reliability prediction result. Although not plotted, the suspension data does influence the appropriate plot positions of the failure data.
For this example, the Weibull Analysis tool in QuART-ER was utilized to perform the analysis. Eta is utilized to calculate the Mean Time To Failure (MTTF) for the system while Beta describes the failure characteristics (e.g. Beta < 1 = early failures, Beta = 1 = constant failure rate, Beta > 1 = wearout condition). Of particular importance in the RCM decision-making process is the value of Beta. In this case the value of Beta is approximately equal to 1 indicating a constant failure rate.
The results showed a good correlation between the plotted failures and the Weibull analysis prediction. The characteristic life, Eta=7,321 hours, was actually much higher than the customer’s expectations, which helped with the “bad news” about Beta. A Beta value of approximately 1.0 indicated that the LRU was failing at a constant failure rate (exponentially distributed). This could be due to a single failure mode, or a mixture of a large number of different failure modes, but separating the data was unlikely with the information that was available at the time.
A constant failure rate is problematic from a maintenance perspective. As the failure rate does not change with age, a newly-installed component has the same probability of failing in the next hundred hours of operation as one that has been running for 1000 hours. With this being the case, proactive maintenance will do you no good. This leads to three possible alternatives; either redesign the component if the reliability is not meeting its reliability requirement, attempt to identify a P-F interval for the system to allow detection prior to failure or run the component to failure before replacing. Fortunately for this customer, the LRU was indeed exceeding its reliability requirement and the decision was easy. Simply let the component fail before replacing.
Conclusion
This discussion was meant to illustrate how Weibull analysis can be used to guide a RCM strategy. Understanding the underlying failure distribution of an item is critical in order to determine whether or not preventive maintenance is appropriate and cost-effective and, if so, at what interval. Equally important is the understanding of preventive and corrective maintenance times, preventive and corrective replacement costs and equipment design life. Finally, a clear understanding of safety and mission reliability requirements is critical for optimizing an RCM-based preventive maintenance program.