Using Accelerated Life Testing to Assess Warranty Risk
During a recent project, a question arose about the feasibility of providing a ten year warranty for a new system. The system consisted of a proven electronic assembly and 40 newly designed hybrid electronic modules. Warranty costs could be significant if reliability risks were not fully understood. The company producing the system wanted to be certain that the probability of failure for any given system was less than 10% during the 10 year warranty period. Thus the reliability, or probability of success, had to be greater than 0.9.
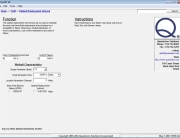
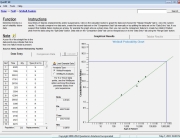
In order to address the warranty risk a reliability analysis of the system was conducted. Field data from the proven assembly (subassembly “A”) indicated that 275 fielded assemblies had accumulated an average of 4,000 hours each, or 1,100,000 total operating hours with no failures. Using the Quanterion Automated Reliability Toolkit (QuART) Chi-Square Confidence Interval Calculation Tool shown in Figure 1, a mean time between failure (MTBF) at 60% confidence of 1,200,493 operating hours, or 833 failures per billion hours (FITS), was estimated based on this data.
Figure 1: Subassembly “A” Reliability Estimate Based on Field Data
Subassembly “B” consisted of 40 newly designed electronic modules with unproven long-term reliability. 25 modules had been subjected to accelerated testing at 85C/85% relative humidity (RH) for 2,000 hours each, or 50,000 total operating hours with zero failures. Using the Peck Temperature/Humidity acceleration model incorporated in the QuART software, an acceleration factor (AF) of 11,363 was estimated between the test environment and operational environment (25C and 30% RH), as shown in Figure 2. Therefore, the 50,000 accelerated test hours is estimated to be equivalent to 50,000 x 11,363 = 568,150,000 operational hours.
Figure 2: Subassembly “B” Acceleration Factor Calculation
As shown in Figure 3, the QuART Chi-Square Confidence Interval Calculation Tool provided an estimated MTBF at 60% confidence of 620 million operating hours, or 1.6 FITS, based on the equivalent operational hour estimate derived above.
Figure 3: Subassembly “B” Reliability Estimate Based on Accelerated Test Data
Using the above data, initial calculations seemed to indicate that the system could meet the self imposed requirement of a reliability greater than 0.9:
- lA = 833 FITS
- lB = (40)(1.6) = 64 FITS
- lSystem = lA + lB = 833 + 64 = 897 FITS
- RSystem(10Years) = e-lt = e-(897×10-9FITS)(10Years)(8760Hr./Yr.) = 0.92
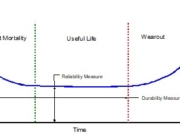
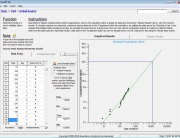
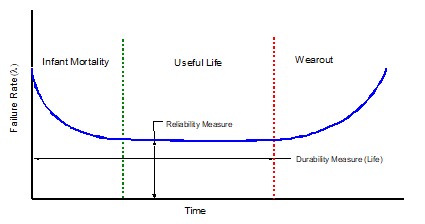
Although the above calculation indicates that the requirement could be met, there was still concern about possible longer term wear-out failure of the new modules. The average time accumulated on any given test module was only 2000 hours and these modules had to live to 87,600 hours with a 0.9 probability. Although an acceleration factor of 11,363 was estimated, this estimate was based on zero failures occurring and assumed default model constants, Ea=1 and n=2.7. These model constants can have a large impact on the estimated acceleration factor. The constants are typically derived by testing sample populations at several stress levels and extrapolating to typical operational environmental conditions, as shown in Figure 4. The more sensitive the item under test is to the imposed stresses, the greater the slope of the projected line. As shown in Figure 4, items exhibiting a failure distribution depicted by the green curves are more sensitive to environmental stress than items represented by the blue curves.

Figure 4: Acceleration Life Test Concept
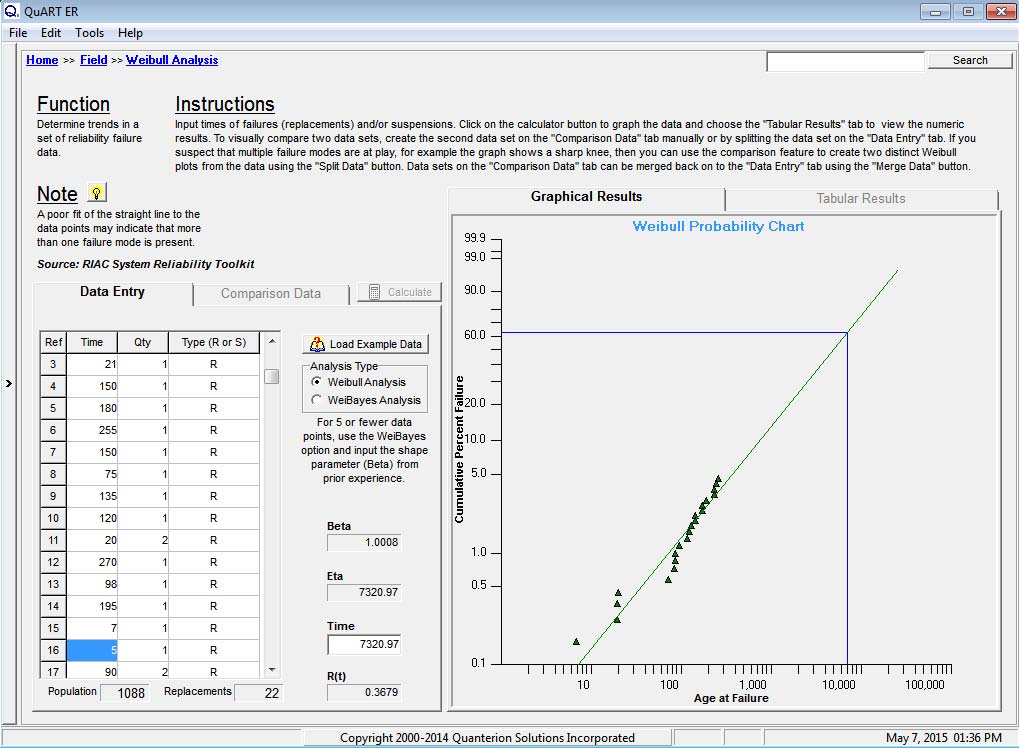
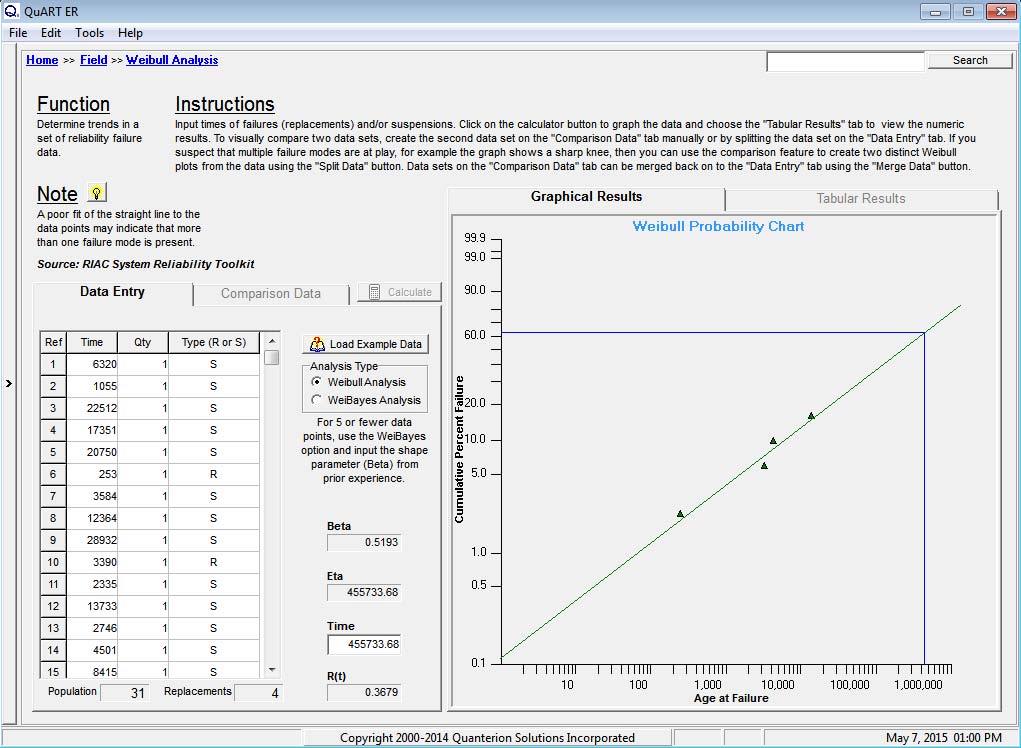
The individual curves shown in Figure 4 are commonly derived by performing a Weibull analysis on accelerated life test failure data derived at each stress level. An example of how to use QuART for performing Weibull analysis was the subject of an earlier Reliability Ques article on Weibull Analysis.
In summary, although initial estimates indicate that warranty risks are acceptable, further testing is being planned to construct a relationship similar to that shown in Figure 4 to ensure that module life is sufficient.
There are many different types of accelerated testing models, strategies and implementation approaches. Table 1 summarizes some common models and example applications.
Table 1: Common Acceleration Models
| Model | Example Application |
| Arrhenius | Model failure mechanisms that depend on temperature (e.g., chemical reactions) |
| Eyring Model | Model multiple stresses. Many other models are simplified versions of the Eyring model. |
| Inverse Power Rule for Voltage (simplified Eyring model) | Capacitor dielectric breakdown |
| Exponential Voltage Model | Capacitor dielectric breakdown |
| Electromigration Model | Semiconductor metallization line failure |
| Coffin-Manson Model | Mechanical crack growth |
Accelerated test strategies can include using a device at a higher duty cycle than normal, such as opening and closing a car door every ten seconds (8640 cycles per 24 hour day), or by stressing items at higher than normal stresses, as discussed in this article. Strategies also include the distribution of test units among the stress levels. For example, putting a smaller percentage of the units on test at higher stress levels in order to collect more data near normal operating stress levels.
In addition to saving time and money, the benefits of accelerated testing include providing an understanding of the relationship between stress level and unit life and identifying design and manufacturing deficiencies. The most significant potential problem with accelerated testing is that failure modes revealed might not be representative of modes exhibited under normal operating conditions.
For more information:
- Accelerated Testing: Statistical Models, Test Plans, and Data Analyses, Wayne Nelson, Wiley Interscience
- The Rome Laboratory Reliability Engineer’s Toolkit, available for free download, contains general guidance and rules of thumb for conducting accelerated testing.
- Comprehensive Model for Humidity Testing Correlation, D. Stewart Peck, 24TH Annual Reliability Physics Symposium Proceedings, 1986.
- How to Plan an Accelerated Life Test: Some Practical Guidelines (The ASQC Basic References in Quality Control ; V. 10), William Q. Meeker, Gerald J. Hahn
- Quanterion Automated Reliability Toolkit (QuART) has demo versions available for free download